Hyperbolas

Mobile Features AB

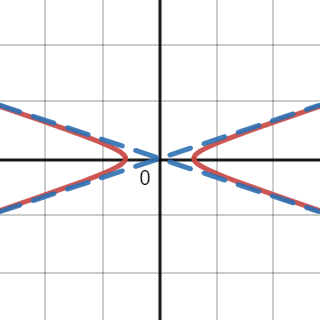
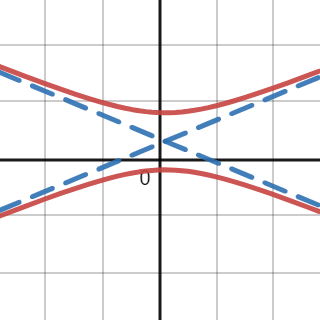
A hyperbola is a type of conic section made up of two curves that resemble parabolas (although they are not). These pairs of curves, also called branches, can either open up and down or left and right. Additionally, each curve contains a vertex.

Get started

Millions of flashcards designed to help you ace your studies

Sign up for free

Achieve better grades quicker with Premium

PREMIUM
Karteikarten Spaced Repetition Lernsets AI-Tools Probeklausuren Lernplan Erklärungen Karteikarten Spaced Repetition Lernsets AI-Tools Probeklausuren Lernplan Erklärungen
Kostenlos testen

Geld-zurück-Garantie, wenn du durch die Prüfung fällst

Review generated flashcards

Sign up for free
You have reached the daily AI limit

Start learning or create your own AI flashcards

StudySmarter Editorial Team

Team Hyperbolas Teachers

  • 14 minutes reading time
  • Checked by StudySmarter Editorial Team
Save Article Save Article
Sign up for free to save, edit & create flashcards.
Save Article Save Article
  • Fact Checked Content
  • Last Updated: 18.04.2022
  • 14 min reading time
Contents
Contents
  • Fact Checked Content
  • Last Updated: 18.04.2022
  • 14 min reading time
  • Content creation process designed by
    Lily Hulatt Avatar
  • Content cross-checked by
    Gabriel Freitas Avatar
  • Content quality checked by
    Gabriel Freitas Avatar
Sign up for free to save, edit & create flashcards.
Save Article Save Article

Jump to a key chapter

    In this article, we aim to look at the properties of hyperbolas and identity equations that describe such conic sections. By familiarizing ourselves with these concepts, we can ultimately graph hyperbolas given a pair of coordinates.

    A hyperbola is the set H of all points P in a plane where the absolute value of the difference in distance between two fixed points, called the foci, F1 and F2, is constant, k, that is

    H={P:||PF1||PF2||=k, k}.

    We shall further look into the components of this graph in the following section.

    To visualize this, observe the graph below.
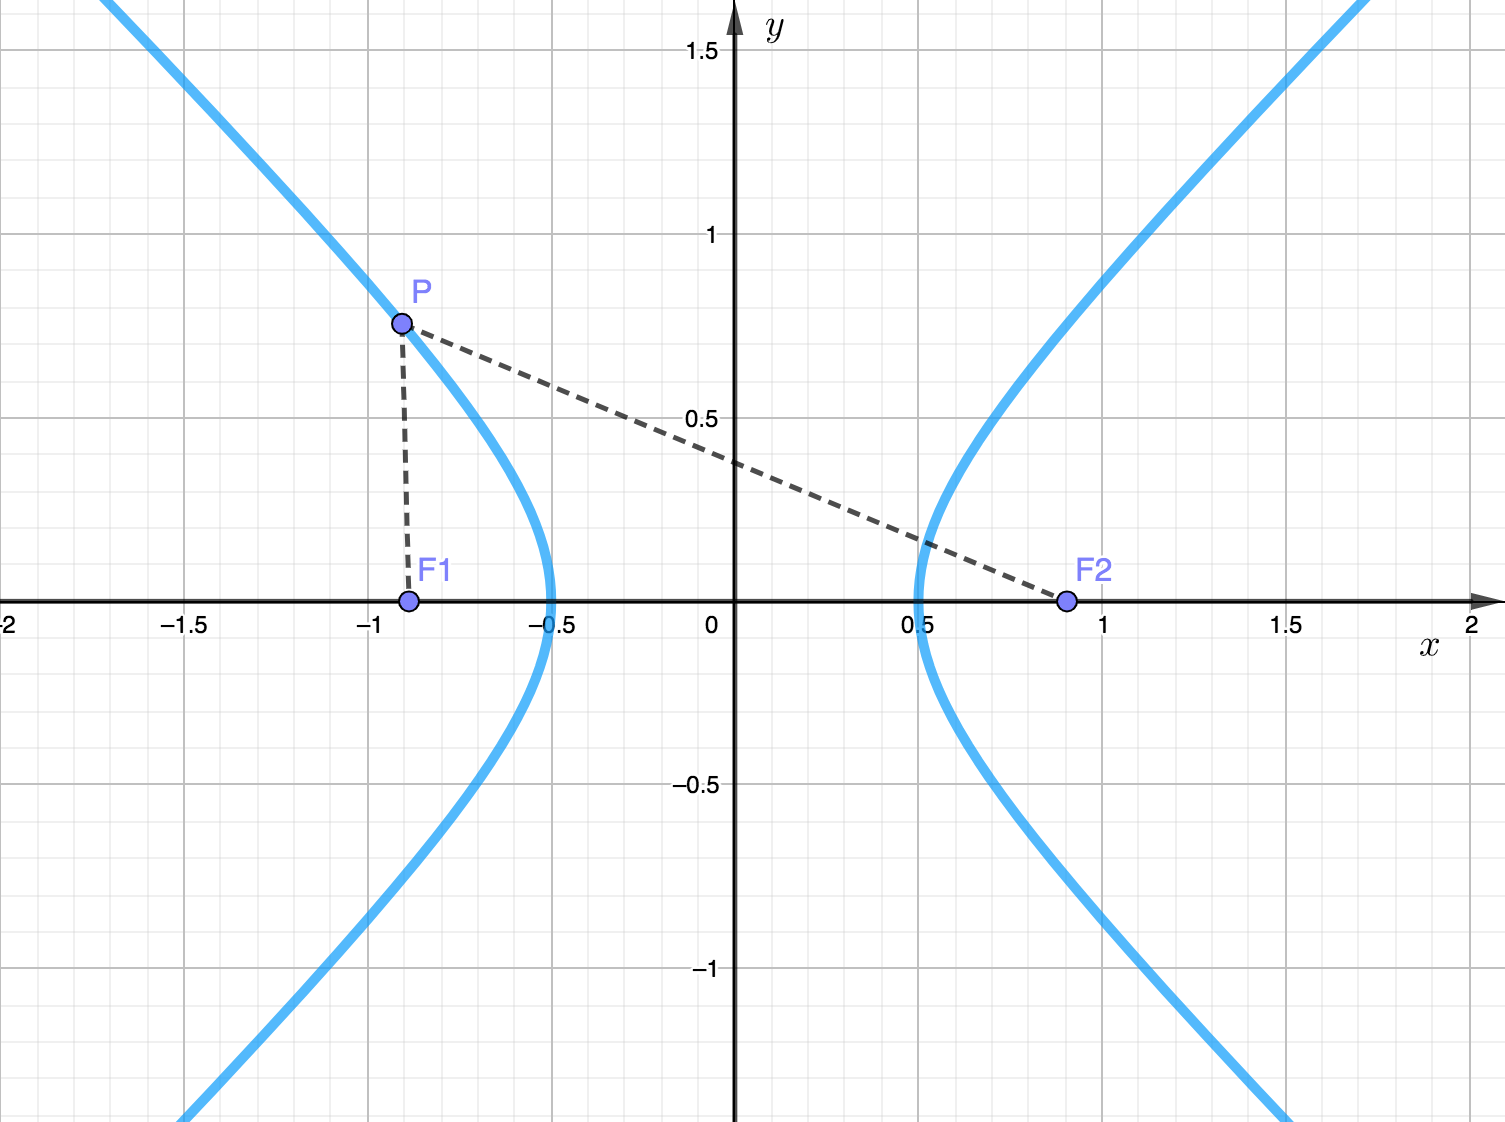
    Notice that unlike other types of conic sections, hyperbolas are made up of two branches rather than one.

    Geometrical Components of a Hyperbola

    From a geometric point of view, a hyperbola is produced when a plane cuts parallel to the cone axis of a double-napped cone.
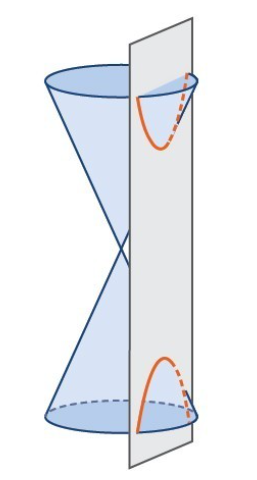
    Let's explore more closely a graphical representation of a hyperbola. Here, we introduce more vital components that make up a hyperbola.
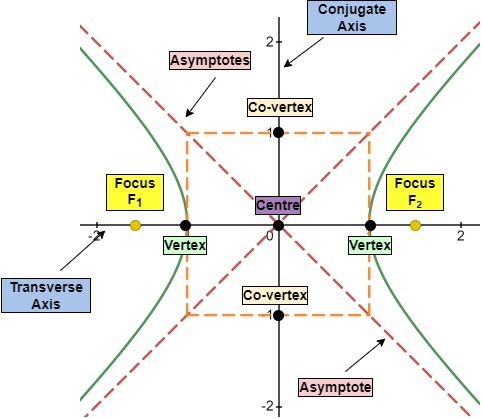
    1. Every hyperbola has two axes of symmetry: the transverse axis and the conjugate axis

    2. The conjugate axis (the y-axis) is a line perpendicular to the transverse axis and contain the co-vertices.

    3. The transverse axis (the x-axis) is a line that passes through the centre of the hyperbola. The foci (focus F1 and focus F2) lie on the transverse line. The vertices are the points of intersection of both branches of the hyperbola with the transverse line. Both foci and vertices are symmetrical in relation to the conjugate axis, which implies that they'll have the same x-coordinate but with opposite signs.

    4. The centre is the midpoint of the transverse axis and conjugate axis. This is where the two lines intersect.

    5. Every hyperbola has two asymptotes (red dashed lines) that pass through the centre. As a hyperbola moves away from its centre, the branches approach these asymptotes. By definition, the branches of the hyperbola will never intersect it's asymptotes.

    6. The central rectangle (orange dashed lines) is centred at the origin. The sides pass through each vertex and co-vertex.

    It is helpful to identify this when graphing the hyperbola and its asymptotes. To draw the asymptotes of the hyperbola, all we have to do is extend the diagonals of the central rectangle.

    Equations of Hyperbolas

    Let us now derive the equation of a hyperbola centred at the origin.
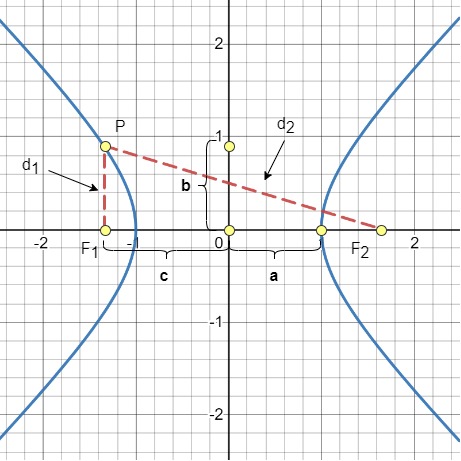
    Let P = (x, y), and the foci of a hyperbola centred at the origin be F1 = (–c, 0) and F2 = (c, 0)

    From the plot above, (a, 0) is a vertex of the hyperbola, and so the distance from (−c, 0) to is . Similarly, the distance from (c, 0) to (a, 0) is .

    The sum of the distances from the foci to the vertex is Let P(x, y) be a point on the hyperbola we want to investigate. From here, we can define d1 and d2 by:

    d1 = distance from (c, 0) to (x, y)

    d2 = distance from (–c, 0) to (x, y)

    d2-d1=(x-(-c))2+(y-0)2-(x-c)2+(y-0)2=2a(x+c)2+y2-(x-c)2+y2=2a(x+c)2+y2=2a+(x-c)2+y2

    Squaring both sides, we obtain

    (x+c)2+y2=2a+(x-c)2+y22x2+2cx+c2+y2=4a2+4a(x-c)2+y2+(x-c)2+y2

    Expanding the binomials and cancelling like terms,

    x2+2cx+c2+y2=4a2+4a(x-c)2+y2+x2-2cx+c2+y24cx-4a2=4a(x-c)2+y2

    Now dividing both sides by 4 and squaring both sides,

    cx-a2=a(x-c)2+y2cx-a22=a(x-c)2+y22

    Expanding this and cancelling like terms again yields,

    c2x2-2a2cx+a4=a2(x2-2cx+c2+y2)c2x2-2a2cx+a4=a2x2-2a2cx+a2c2+a2y2c2x2-a2x2-a2y2=a2c2-a4

    This simplifies to

    x2b2-a2y2=a2b2

    Now dividing both sides by a2b2, the equation for the hyperbola becomes

    x2a2-y2b2=1

    as required! Below is a worked example that demonstrates the use of the Distance Formula in regards to hyperbolas.

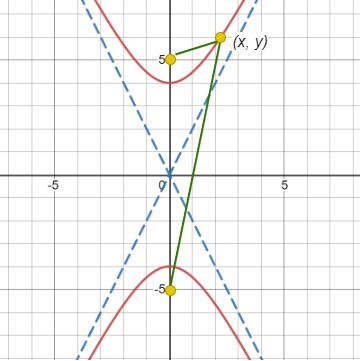
    Determine the equation of the hyperbola represented by the graph below.
    Solution

    The hyperbola below has foci at (0 , –5) and (0, 5) while the vertices are located at (0, –4) and (0, 4). The distance between these two coordinates is 8 units.

    Thus, the difference between the distance from any point (x, y) on the hyperbola to the foci is 8 or –8 units, depending on the order in which you subtract.

    Using the Distance Formula, we obtain the equation of the hyperbola as follows.

    Let,

    d1 = distance from (0, 5) to (x, y)

    d2 = distance from (0, –5) to (x, y)

    d2-d1=±8(y-5)2+x2-(y+5)2+x2=±8(y-5)2+x2=±8+(y+5)2+x2(y-5)2+x2=±8+(y+5)2+x22y2-10y+25+x2=64+16(y+5)2+x2+(y+5)2+x2y2-10y+25+x2=64±16(y+5)2+x2+y2+10y+25+x2-20y-64=±16(y+5)2+x25y+16=±4(y+5)2+x25y+162=16(y+5)2+x2225y2+160y+256=16(y2+10y+25+x2)25y2+160y+256=16y2+160y+400+16x29y2-16x2=144

    By dividing the expression by 9×16, our final yield becomes

    y216+x29=1

    Properties of Hyperbolas

    Let us now move on to the properties of hyperbolas. There are two cases to consider here:

    Case 1: Hyperbolas Centred at the Origin (0, 0)

    PropertyCentre (0,0)
    Standard Form of Equationx2a2-y2b2=1y2a2-x2b2=1
    General Plot

    OpeningOpens left and rightOpens up and down
    Direction of Transverse AxisHorizontalVertical
    Foci(c, 0), (-c, 0) (0, c), (0, -c)
    Vertices(a, 0), (-a, 0) (0, a), (0, -a)
    Length of Transverse Axis 2a units2a units
    Length of Conjugate Axis 2b unites2b units
    Equation of Asymptotes y=±baxy=±abx

    Case 2: Hyperbolas Centred at (h, k)

    PropertyCentre (h,k)
    Standard Form of Equation(x-h)2a2-(y-k)2b2=1(y-k)2a2-(x-h)2b2=1
    General Plot

    Vertices(h + a, k), (h - a, k) (h, k + a), (h, k - a)
    Foci(h + c, k), (h - c, k) (h, k + c), (h, k - c)
    Equation of Asymptotesy=k±ba(x-h)y=k±ab(x-h)

    Locating the Foci and Vertices of a Given Hyperbola

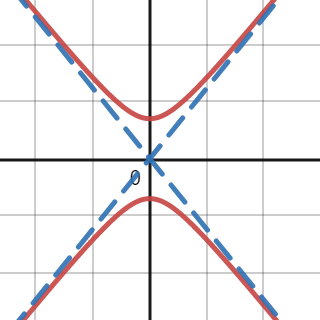
    Identify the foci and vertices for the hyperbola y249-x232=1.

    Solution

    The equation is of the form

    y2a2-x2b2=1

    Thus, the transverse axis lies on the y-axis. The centre is at the origin, so the y-intercepts are the vertices of the graph. We can thus find the vertices by setting x = 0 and solve for y as below.

    y249-(0)232=1y249=1y2=49y=±49=±7

    The foci are located at (0,±c) and by the relationship between a, b and c established before, we obtain

    c2=a2+b2c=±a2+b2=±49+32=±81=±9


    Thus, the vertices are (0, –7) and (0, 7) while the foci are (0, –9) and (0, 9). The graph is shown below.
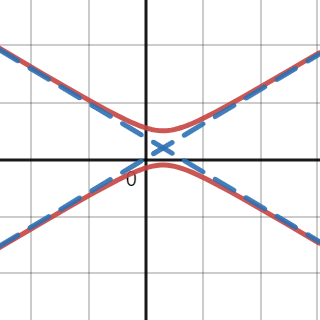
    Identify the foci and vertices for the hyperbola (y-2)29-(x-3)225=1.

    Solution

    The equation is of the form

    (y-k)2a2-(x-h)2b2=1

    Thus, the transverse axis lies on the y-axis. Here, h = 3 and k = 2, so the centre is at (3, 2). To find the vertices, we shall make use of the formula below.

    (h, k±a)(3, 2±9)=(3, 2±3)

    The foci are located at (0,±c) and using c2=a2+b2 as before, we obtain

    c=±9+25=±34±5.83 (correct to two decimal places)

    Thus, the vertices are (3, –1) and (3, 5) while the foci are (0, –5.83) and (0, 5.83). The graph is shown below.
    The equation for the asymptotes can be found using the formula given in the table. Give it a try for these examples! It is always helpful to sketch the asymptotes first before drawing the two branches of a hyperbola.

    Finding the Equation of a Hyperbola Given the Foci and Vertices

    Express the following hyperbola in standard form given the following foci and vertices.

    Vertices: (±6, 0)Foci: (±210, 0)

    Solution

    Notice that the vertices and foci are on the x-axis. Hence, the equation of the hyperbola will take the form

    x2a2-y2b2=1

    Since the vertices are (±6, 0),then

    a=6a2=36

    Given the foci are (±210, 0),then

    c=210c2=40

    Solving for b2 we obtain

    b2=c2-a2=40-36b2=4

    Now that we have found a2 and b2, we can substitute this into the standard form as

    x236-y24=1

    The graph is shown below.

    Express the following hyperbola in standard form given the following foci and vertices.

    Vertices: (1, -2) and (1, 8)Foci: (1, -10) and (1, 16)

    Solution

    The vertices and foci have the same x-coordinates, so the transverse axis is parallel to the y-axis. The equation of the hyperbola will thus take the form

    (y-k)2a2-(x-h)2b2=1

    We must first identify the centre using the midpoint formula. The centre lies between the vertices (1, –2) and (1, 8), so

    (h, k)=1+12, -2+82=(1, 3)

    The length of the transverse axis, 2a, is bounded by the vertices. To find a2 we must evaluate the distance between the y-coordinates of the vertices.

    2a=-2-8=-10=10a=5a2=25

    The coordinates of the foci are

    (h, k±c)(h, k-c)= (1, -10) and (h, k+c)=(1, 16)

    Using k + 3 = 16 and substituting k = 3, we obtain

    c=13c2=169

    Thus, we can solve for b2 by

    b2= c2- a2b2= 169- 25=144

    Finally, substituting these values into the standard form, we obtain

    (y-3)225-(x-1)2144=1

    The graph is shown below.

    Graphing Hyperbolas

    In this final section, we shall graph hyperbolas using the concepts introduced throughout this lesson.

    Graph an Equation in Standard Form

    Let us return to our previous examples for this segment,

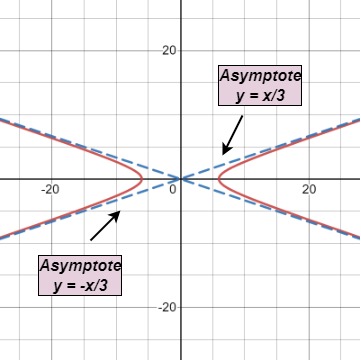
    Graph the hyperbola x236-y24=1

    Solution

    As you can see, the hyperbola is already in the standard form.

    x2a2-y2b2=1

    This means that we have a pair of curves opening from the left and right. The vertices are (±6, 0) and the foci are (±210, 0). The centre of the hyperbola is the origin, (0, 0). Here,

    a2=36a=6 and b2=4b=2

    The equation of the asymptotes are

    y=±bax=±26x=±13x

    Always sketch the asymptotes when graphing hyperbolas. That way, we can accurately draw the curves associated with the equation.

    The graph of x236-y24=1 is shown below.

    Graph an Equation Not in Standard Form

    In this section, it may be helpful to recall the method of Completing Squares to solve such problems.

    Graph the hyperbola below.

    9x2-25y2-36x-50y-214=0

    Solution

    To solve this expression, we must attempt to rearrange this in the standard form of a hyperbola. We do this by completing the square as follows.

    9x2-36x-25y2-50y=2149(x2-4x+A)-25(y2+2y+B)=214+9(A)-25(B)

    We need to identify A and B. In doing so, we obtain

    9(x2-4x+4)-25(y2+2y+1)=214+9(4)-25(1)9(x-2)2-25(y+1)2=225

    Dividing both sides by 225, we obtain the equation

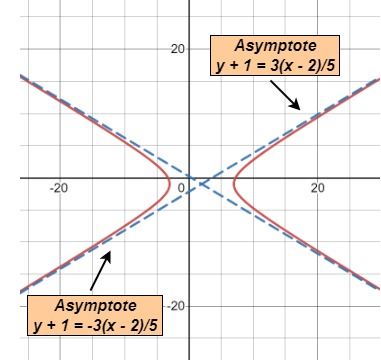
    (x-2)225-(y+1)29=1

    The centre is (2, –1). We also have the values h=2, k=-1, a=5, b=3 and c=34. Thus we obtain the following values for the vertices, foci and asymptotes.

    The vertices

    (h±a,k)=(2±5,-1)(-3,-1) and (7,-1)

    The foci

    (h±c,k)=(2±34,-1)(2-34,-1) and (2-34,-1)

    The asymptotes

    y=k±ba(x-h)=-1±35(x-2)y+1=-35(x-2) and y+1=35(x-2)

    The graph of (x-2)225-(y+1)29=1 is shown below.

    The Eccentricity of a Hyperbola

    The eccentricity of a conic section describes how closely related the curve is compared to a circle. The eccentricity is described by the variable e.

    The eccentricity of a circle is zero, e = 0.

    The eccentricity of a hyperbola is always more than 1, e > 1. The formula for finding the eccentricity of a hyperbola is given below.

    Formula: Eccentricity of a Hyperbola

    e=a2+b2a

    The bigger the eccentricity, the less curved the conic section is.

    Find the eccentricity of the hyperbola x225-y29=1

    Solution

    Here, a2 = 25 and b2 = 9. Thus, the eccentricity of this hyperbola is given by

    a=25=5e=25+95e=3451.17 (correct to two decimal places)

    Hyperbolas - Key takeaways

    • To locate the vertices and foci given the equation of a hyperbola in standard form, we adopt the following steps:
      1. Identify the location of the transverse axis
        If the equation is of the form x2a2-y2b2=1 transverse axis lies on the x-axis andthe vertices are (±a, 0) and the foci are (±c, 0)
        If the equation is of the form y2a2-x2b2=1 transverse axis lies on the y-axis andthe vertices are (0, ±a) and the foci are (0, ±c)
      2. Solve for a using a=a2
      3. Solve for c using c=a2+b2
    • To express an equation in standard form given the vertices and foci for a hyperbola centred at (0,0), we use the method below:
      1. Determine the location of the transverse axis
        If the vertices are (±a, 0) and the foci are (±c, 0) transverse axis lies on the x-axis andthe equation is of the form x2a2-y2b2=1
        If the vertices are (0, ±a) and the foci are (0, ±c) transverse axis lies on the y-axis andthe equation is of the form y2a2-x2b2=1
      2. Solve for b2 using b2 = c2 - a2
      3. Substitute a2 and b2 into the standard form established in Step 1
    • To write an equation in standard form given the vertices and foci for a hyperbola centred at (h,k), we apply the technique below:
      1. Decide whether the transverse axis is parallel to the x-axis or y-axis
        If the y-coordinates of the vertices and foci are the same transverse axis lies on the x-axis andthe equation is of the form (x-h)2a2-(y-k)2b2=1
        If the x-coordinates of the vertices and foci are the same transverse axis lies on the y-axis andthe equation is of the form (y-k)2a2-(x-h)2b2=1
      2. Identify the centre of the hyperbola, (h, k) using the Midpoint Formula given coordinates of the vertices (h, k)=x1+x22, y1+y22
      3. Evaluate a2 by solving the length of the transverse axis, 2a. This is given by the distance between the two vertices
      4. Evaluate c2 by using the coordinates of the given foci and the values of h and k determined in Step 2
      5. Solve for b2
      6. Substitute a2, b2, h and k into the standard form established in Step 1
    Frequently Asked Questions about Hyperbolas

    What is a hyperbola in math? 

    A hyperbola is the set of all points in a plane where the absolute value of the difference in distance between two fixed points, called the foci, is constant

    how to find asymptotes of hyperbola 

    The asymptotes for the general form of a hyperbola is given by y = ± bx/a 

    how to draw hyperbola by rectangular method 

    1. Find the centre of the hyperbola
    2. Locate the vertices and construct the corresponding vertical lines
    3. Determine the co-vertices and construct the corresponding horizontal lines 
    4. This creates a rectangle
    5. Draw two diagonal lines for this rectangle. These are the asymptotes of the hyperbola
    6. Sketch the curves

    how to find the equation of a hyperbola 

    1. Decide whether the transverse axis is parallel to the x-axis or y-axis
    2. Identify the centre of the hyperbola, (h, k) using the Midpoint Formula given coordinates of the vertices 
    3. Evaluate a2 by solving the length of the transverse axis, 2a. This is given by the distance between the two vertices
    4. Evaluate c2 by using the coordinates of the given foci and the values of h and k determined in Step 2
    5. Solve for b2
    6. Substitute a2b2, h and into the standard form established in Step 1

    What is hyperbola graph? 

    A hyperbola is a type of conic section made up of two parabola-like shaped curves. These pairs of curves can either open up and down or left and right. Additionally, each curve contains a vertex. However, it is crucial to note that these curves are not exactly parabolas (they only resemble them!) 

    Save Article

    Test your knowledge with multiple choice flashcards

    Which directions do the pair of curves for a hyperbola \[  \frac{(y-k)^2}{a^2} - \frac{(x-h)^2}{b^2} = 1\]open up?

    For a hyperbola of the form\[   \frac{(x-h)^2}{a^2}  - \frac{(y-k)^2}{b^2} = 1 \] state the coordinates of its vertices.

    For a hyperbola of the form\[   \frac{(x-h)^2}{a^2}  - \frac{(y-k)^2}{b^2} = 1 \]what are the coordinates of its foci?

    Next
    How we ensure our content is accurate and trustworthy?

    At StudySmarter, we have created a learning platform that serves millions of students. Meet the people who work hard to deliver fact based content as well as making sure it is verified.

    Content Creation Process:
    Lily Hulatt Avatar

    Lily Hulatt

    Digital Content Specialist

    Lily Hulatt is a Digital Content Specialist with over three years of experience in content strategy and curriculum design. She gained her PhD in English Literature from Durham University in 2022, taught in Durham University’s English Studies Department, and has contributed to a number of publications. Lily specialises in English Literature, English Language, History, and Philosophy.

    Get to know Lily
    Content Quality Monitored by:
    Gabriel Freitas Avatar

    Gabriel Freitas

    AI Engineer

    Gabriel Freitas is an AI Engineer with a solid experience in software development, machine learning algorithms, and generative AI, including large language models’ (LLMs) applications. Graduated in Electrical Engineering at the University of São Paulo, he is currently pursuing an MSc in Computer Engineering at the University of Campinas, specializing in machine learning topics. Gabriel has a strong background in software engineering and has worked on projects involving computer vision, embedded AI, and LLM applications.

    Get to know Gabriel

    Discover learning materials with the free StudySmarter app

    Sign up for free
    1
    About StudySmarter

    StudySmarter is a globally recognized educational technology company, offering a holistic learning platform designed for students of all ages and educational levels. Our platform provides learning support for a wide range of subjects, including STEM, Social Sciences, and Languages and also helps students to successfully master various tests and exams worldwide, such as GCSE, A Level, SAT, ACT, Abitur, and more. We offer an extensive library of learning materials, including interactive flashcards, comprehensive textbook solutions, and detailed explanations. The cutting-edge technology and tools we provide help students create their own learning materials. StudySmarter’s content is not only expert-verified but also regularly updated to ensure accuracy and relevance.

    Learn more
    StudySmarter Editorial Team

    Team Math Teachers

    • 14 minutes reading time
    • Checked by StudySmarter Editorial Team
    Save Explanation Save Explanation

    Study anywhere. Anytime.Across all devices.

    Sign-up for free

    Sign up to highlight and take notes. It’s 100% free.

    Join over 22 million students in learning with our StudySmarter App

    The first learning app that truly has everything you need to ace your exams in one place

    • Flashcards & Quizzes
    • AI Study Assistant
    • Study Planner
    • Mock-Exams
    • Smart Note-Taking
    Join over 22 million students in learning with our StudySmarter App
    Sign up with Email